


Well, it's about time!
If you watched our January Market & Economic Update, you will recall that the average stock actually under-performed a decent Money Market Fund in 2025. We determine this by looking at the Value Line Geometric Average. Recall that this Average captures about 90% of the U.S. Stock Market. Furthermore, it is an equal-weight index. As a result of these two points, the Value Line Geometric Average gives us an excellent approximation of what is happening with the average stock.
In our January Market & Economic Video (which you can find here), we highlighted the fact that while the Value Line did recover after the "Tariff Tantrum" we saw in March of last year, the index was really unable to move higher. Effectively, the Value Line Geometric Average was building what is called "a base". Traditionally, when a stock or index breaks out of these bases it signifies a new trend.
Well, last week, the Value Line Geometric Average finally broke out from this base. [See chart above.]
While that, by itself, should be encouraging, take a look at the chart below.
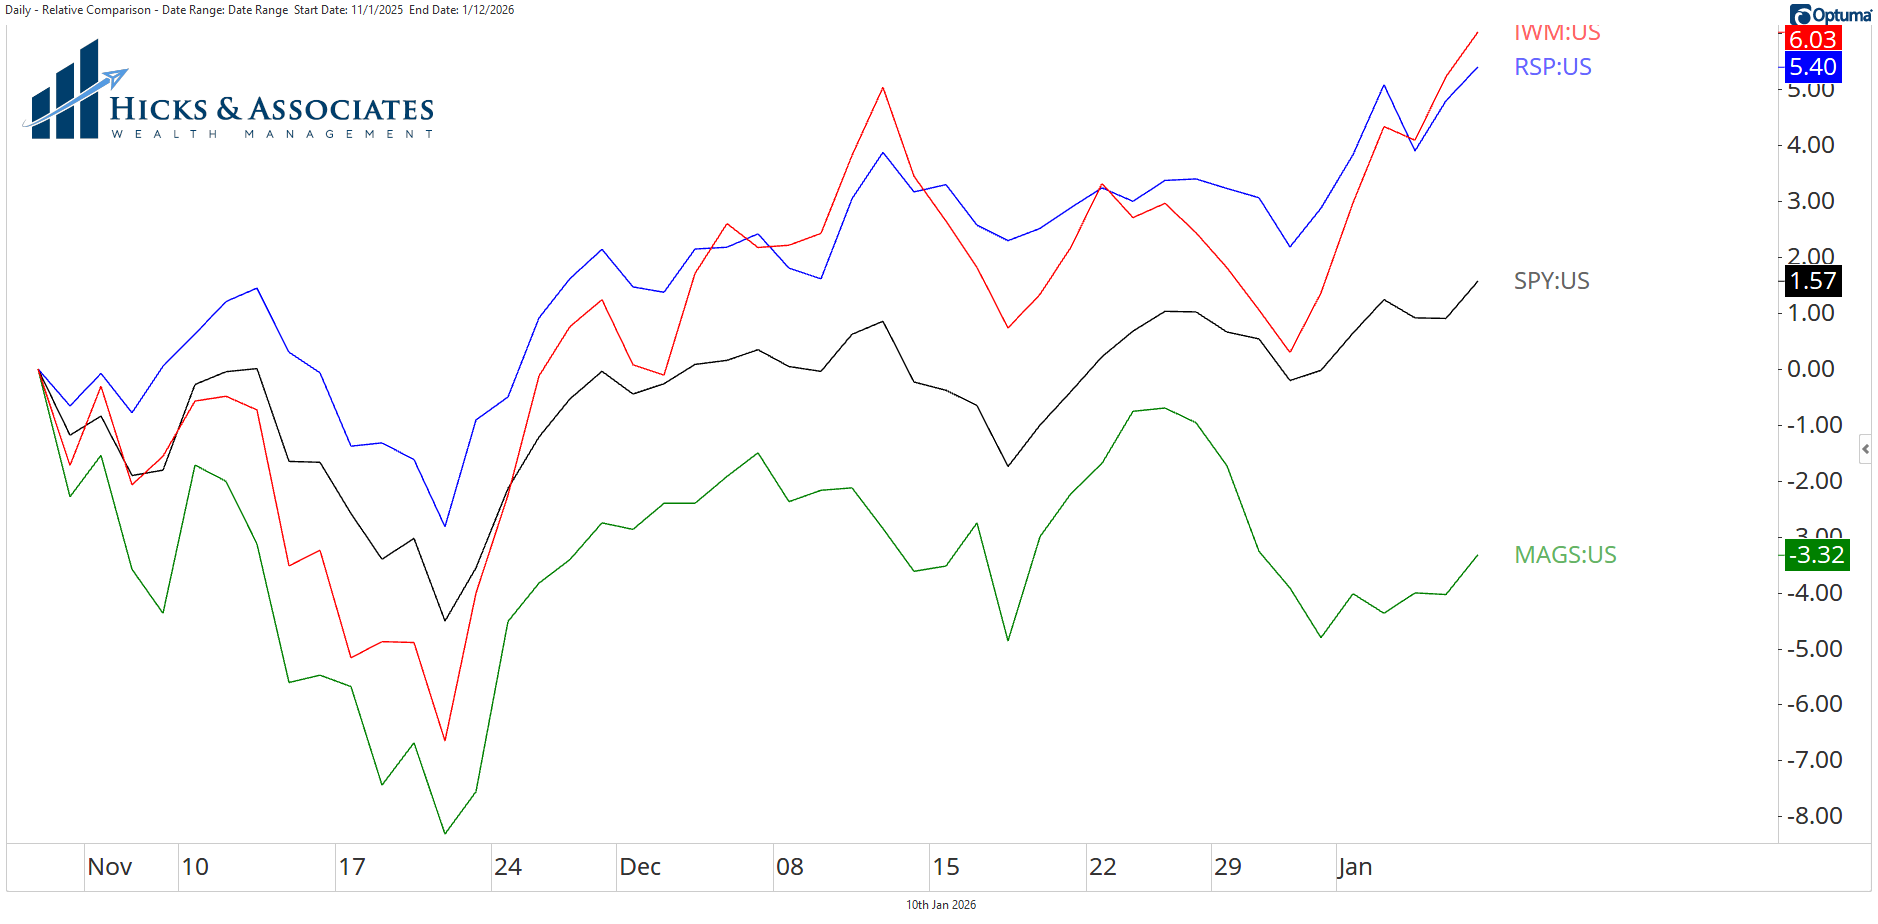
The chart above is a Relative Comparison (performance) chart for 4 ETFs:
- MAGS - An ETF focused on the Magnificent 7 stocks.
- SPY - A Cap-Weighted S&P 500 ETF
- RSP - An Equal-Weighted S&P 500 ETF
- IWM - The iShares Russell 2000 ETF
The comparison is from November 1st. Notice which ETF is at the bottom; MAGS. Furthermore, notice that MAGS has a negative 3.32% return since November 1st. Meanwhile, we see the iShares Russell 2000 (IWM) at the top of this comparison chart with a performance of 6.03%. The Russell 2000 is a small company index.
It appears that leadership is finally rotating away from a select few stocks: Small Company stocks have taken over leadership. This is a hallmark of a traditionally healthy, robust bull market.
One more chart for today:
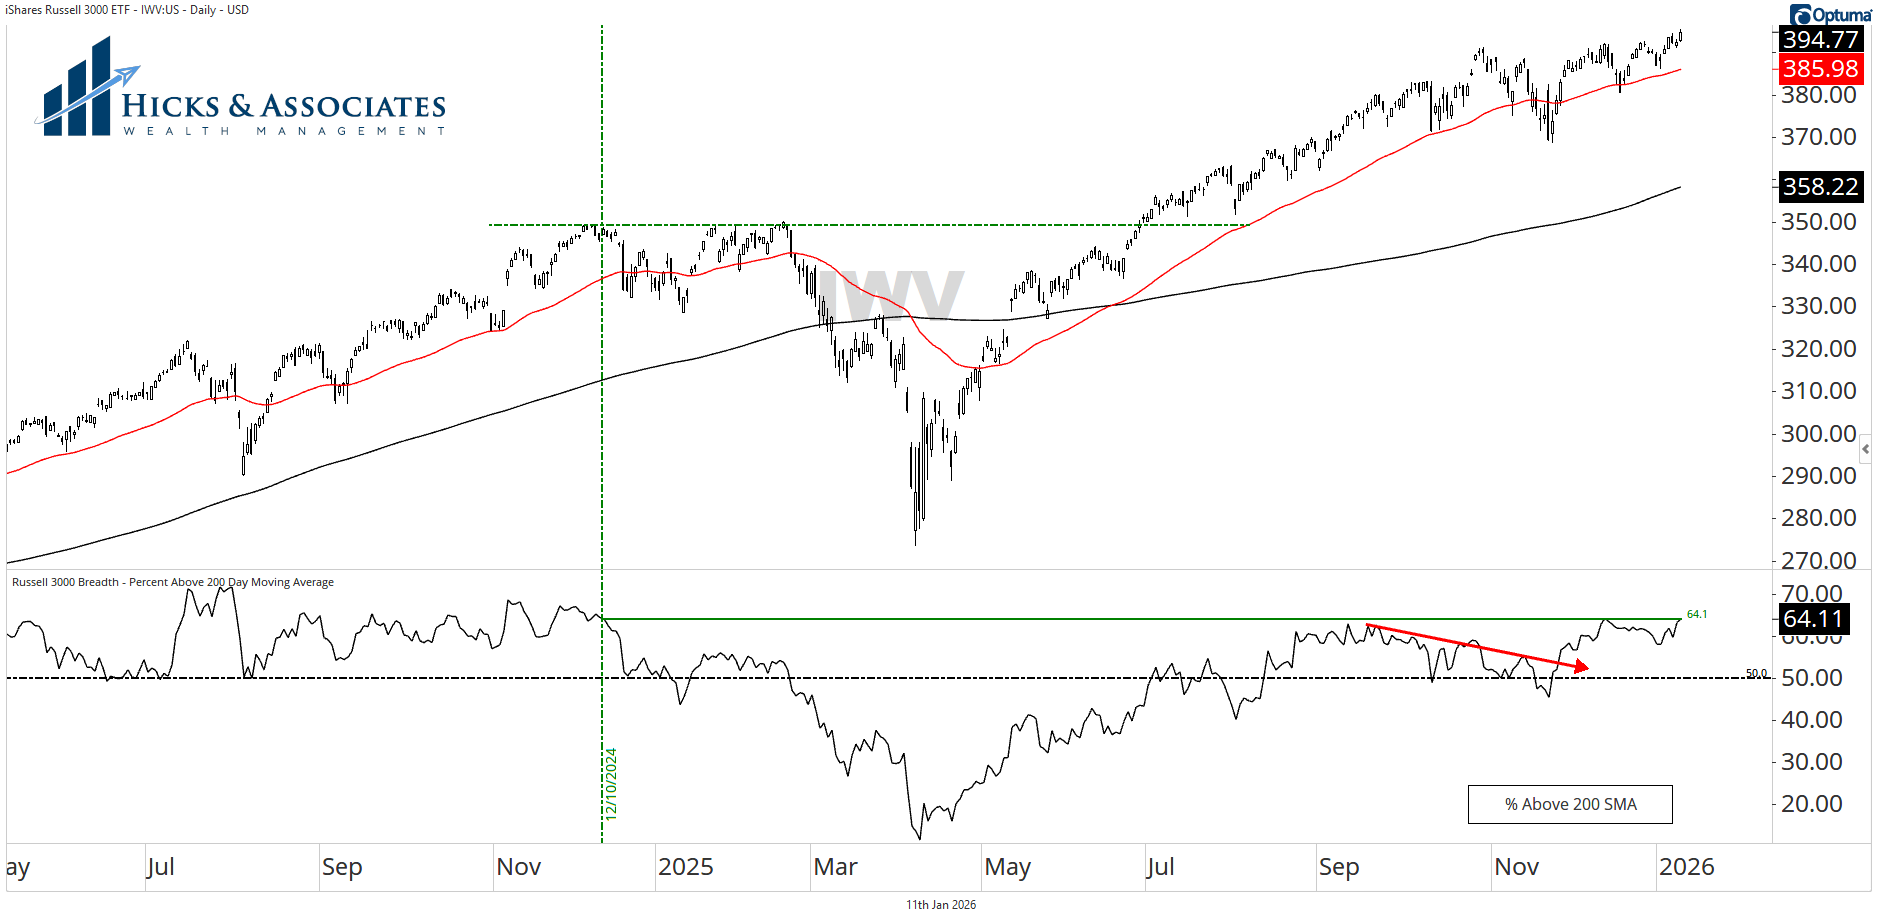
Our final chart for today is of IWV, the iShares Russell 3000 ETF. This ETF captures about 95% of the US stock market. We have to remember that IWV is also cap-weighted so it offers some of the same problems as the traditional S&P 500. However, since it captures such a broad swath of the US stock market, we like to use this ETF as another measure of breadth, or participation.
With that said, look at the bottom pane of this chart. This bottom pane shows what percent of the IWV constituents that are above their own 200-day moving average. Last week, this measure ended at 64.11% a height that we have not seen since December 10th, 2024.
These are signs that the bull market is broadening out. A great way to start the New Year.
This information is intended to be educational. Hicks & Associates Wealth Management does not provide tax or legal advice. You should consult with a qualified tax, legal or financial professional before making any decisions.
Investment advisory services are offered through Hicks & Associates Wealth Management, LLC (“Hicks & Associates”), an investment adviser registered with the Securities and Exchange Commission. Registration as an investment adviser does not imply a certain level of skill or training. More information about Hicks & Associates can be found in Form ADV Part 2 or Form CRS which is available on our website.
Past performance is no guarantee of future returns. Hicks & Associates reserves the right to modify its current investment strategies and techniques based on changing market dynamics or client needs. The visuals shown are for illustrative purposes only and do not guarantee success or certain level of performance. This material contains projections, forecasts, estimates, beliefs and similar information (“forward looking information”). Forward looking information is subject to inherent uncertainties and qualifications and is based on numerous assumptions, in each case whether or not identified herein.
This information may be taken, in part, from external sources. We believe these external sources to be reliable, but no warranty is made as to accuracy. This material is not financial advice or an offer to sell any product. There is no guarantee of the future performance of any Hicks & Associates portfolio. The investment strategies discussed may not be suitable for all investors. Before investing, consider your investment objectives and Hicks & Associates charges and expenses. All investment strategies have the potential for profit or loss.