


This is very bullish folks.
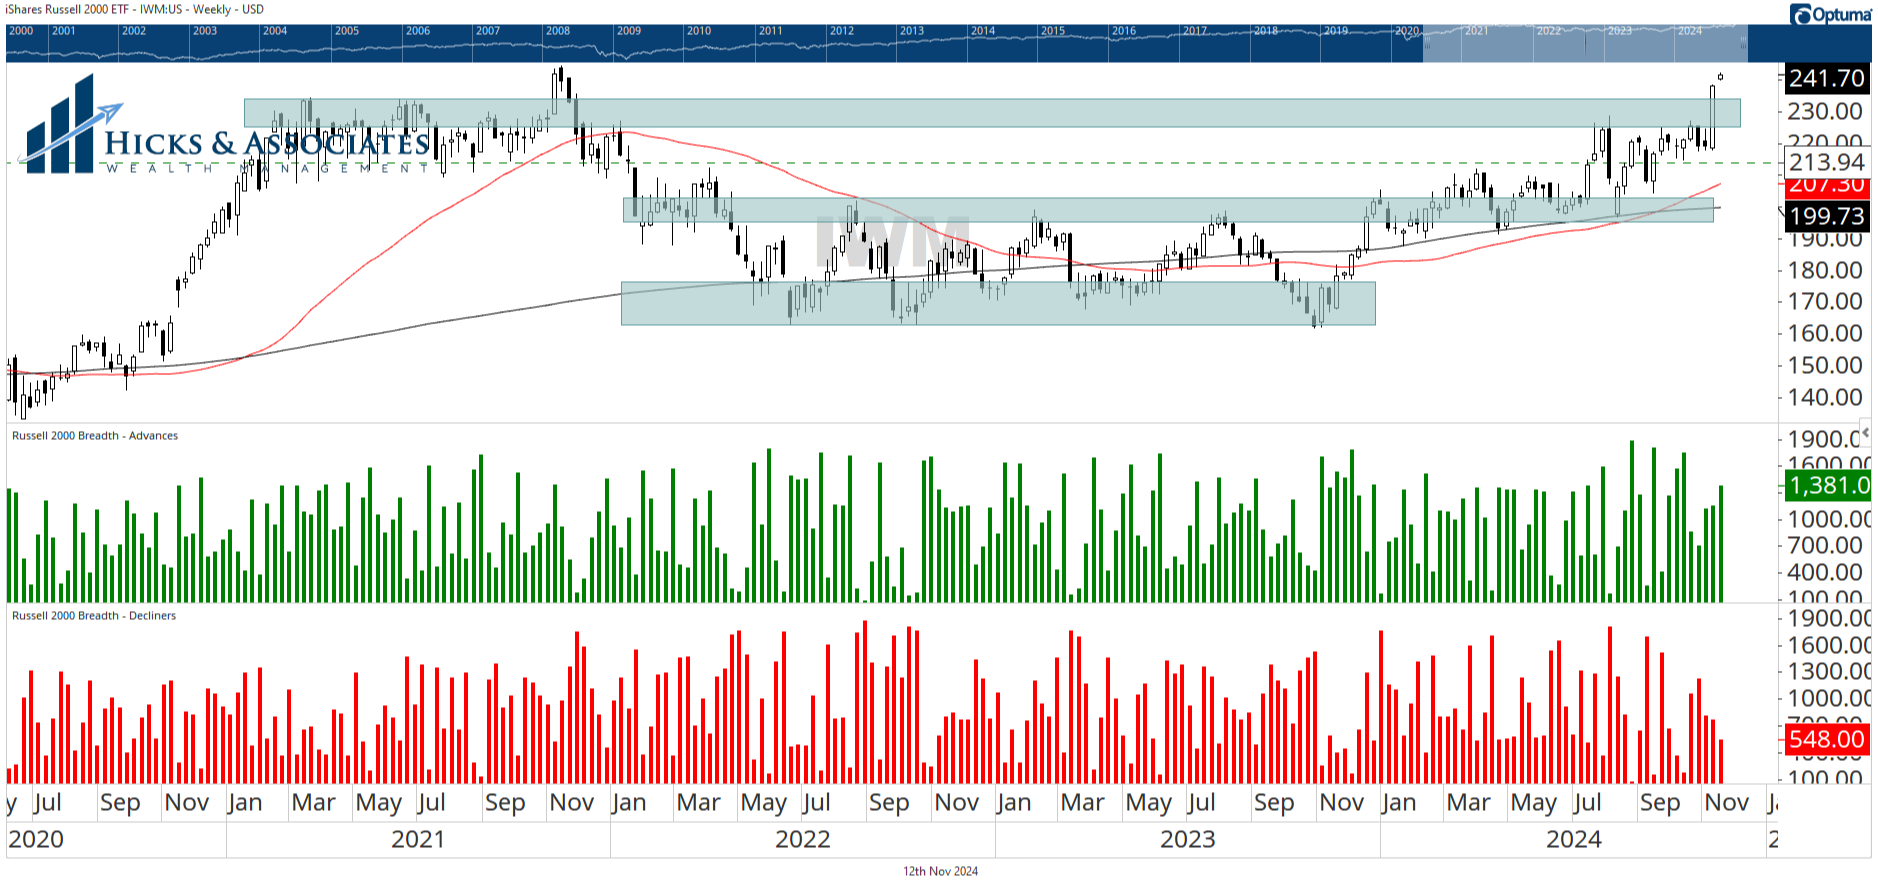
The top pane is the weekly candle chart for the iShares Russell 2000 ETF (Ticker: IWM). You can see three blue/gray bars that I've added to the chart. The bottom two bars represent the zone I've been discussing for quite some time. In short, small-cap stocks were struggling to break through the top end of that two year trading range.
They finally started to break through earlier this year ... but did not have enough escape velocity to really propel much higher.
Then, recently, that started facing the resistance of that top blue/gray bar which represents the highs from 2021. Last week's action was incredibly bullish, rocketing small caps through that upper resistance zone.
The bottom two panes are the advancing stocks and the declining stocks. Again, these are weekly stats and I'm posting this on Tuesday before the opening bell. As a result, the last green & red bars represent Monday. If that trend continues through the rest of the week, we would see advancing stocks advancing over the last four weeks.
This information is intended to be educational. Hicks & Associates Wealth Management does not provide tax or legal advice. You should consult with a qualified tax, legal or financial professional before making any decisions.
Investment advisory services are offered through Hicks & Associates Wealth Management, LLC (“Hicks & Associates”), an investment adviser registered with the Securities and Exchange Commission. Registration as an investment adviser does not imply a certain level of skill or training. More information about Hicks & Associates can be found in Form ADV Part 2 or Form CRS which is available on our website.
Past performance is no guarantee of future returns. Hicks & Associates reserves the right to modify its current investment strategies and techniques based on changing market dynamics or client needs. The visuals shown are for illustrative purposes only and do not guarantee success or certain level of performance. This material contains projections, forecasts, estimates, beliefs and similar information (“forward looking information”). Forward looking information is subject to inherent uncertainties and qualifications and is based on numerous assumptions, in each case whether or not identified herein.
This information may be taken, in part, from external sources. We believe these external sources to be reliable, but no warranty is made as to accuracy. This material is not financial advice or an offer to sell any product. There is no guarantee of the future performance of any Hicks & Associates portfolio. The investment strategies discussed may not be suitable for all investors. Before investing, consider your investment objectives and Hicks & Associates charges and expenses. All investment strategies have the potential for profit or loss.