


While we utilize both fundamental and technical analysis, we absolutely have a bias towards technical analysis. Arguably the biggest reason we use technical analysis in our work is the simple realization that volatility begets volatility.
If you understand statistics, you know that “standard deviation” is simply the amount of variation from the mean. You might also remember that 97% of normally distributed data falls within three standard deviations.
If you need a refresher in statistics ...
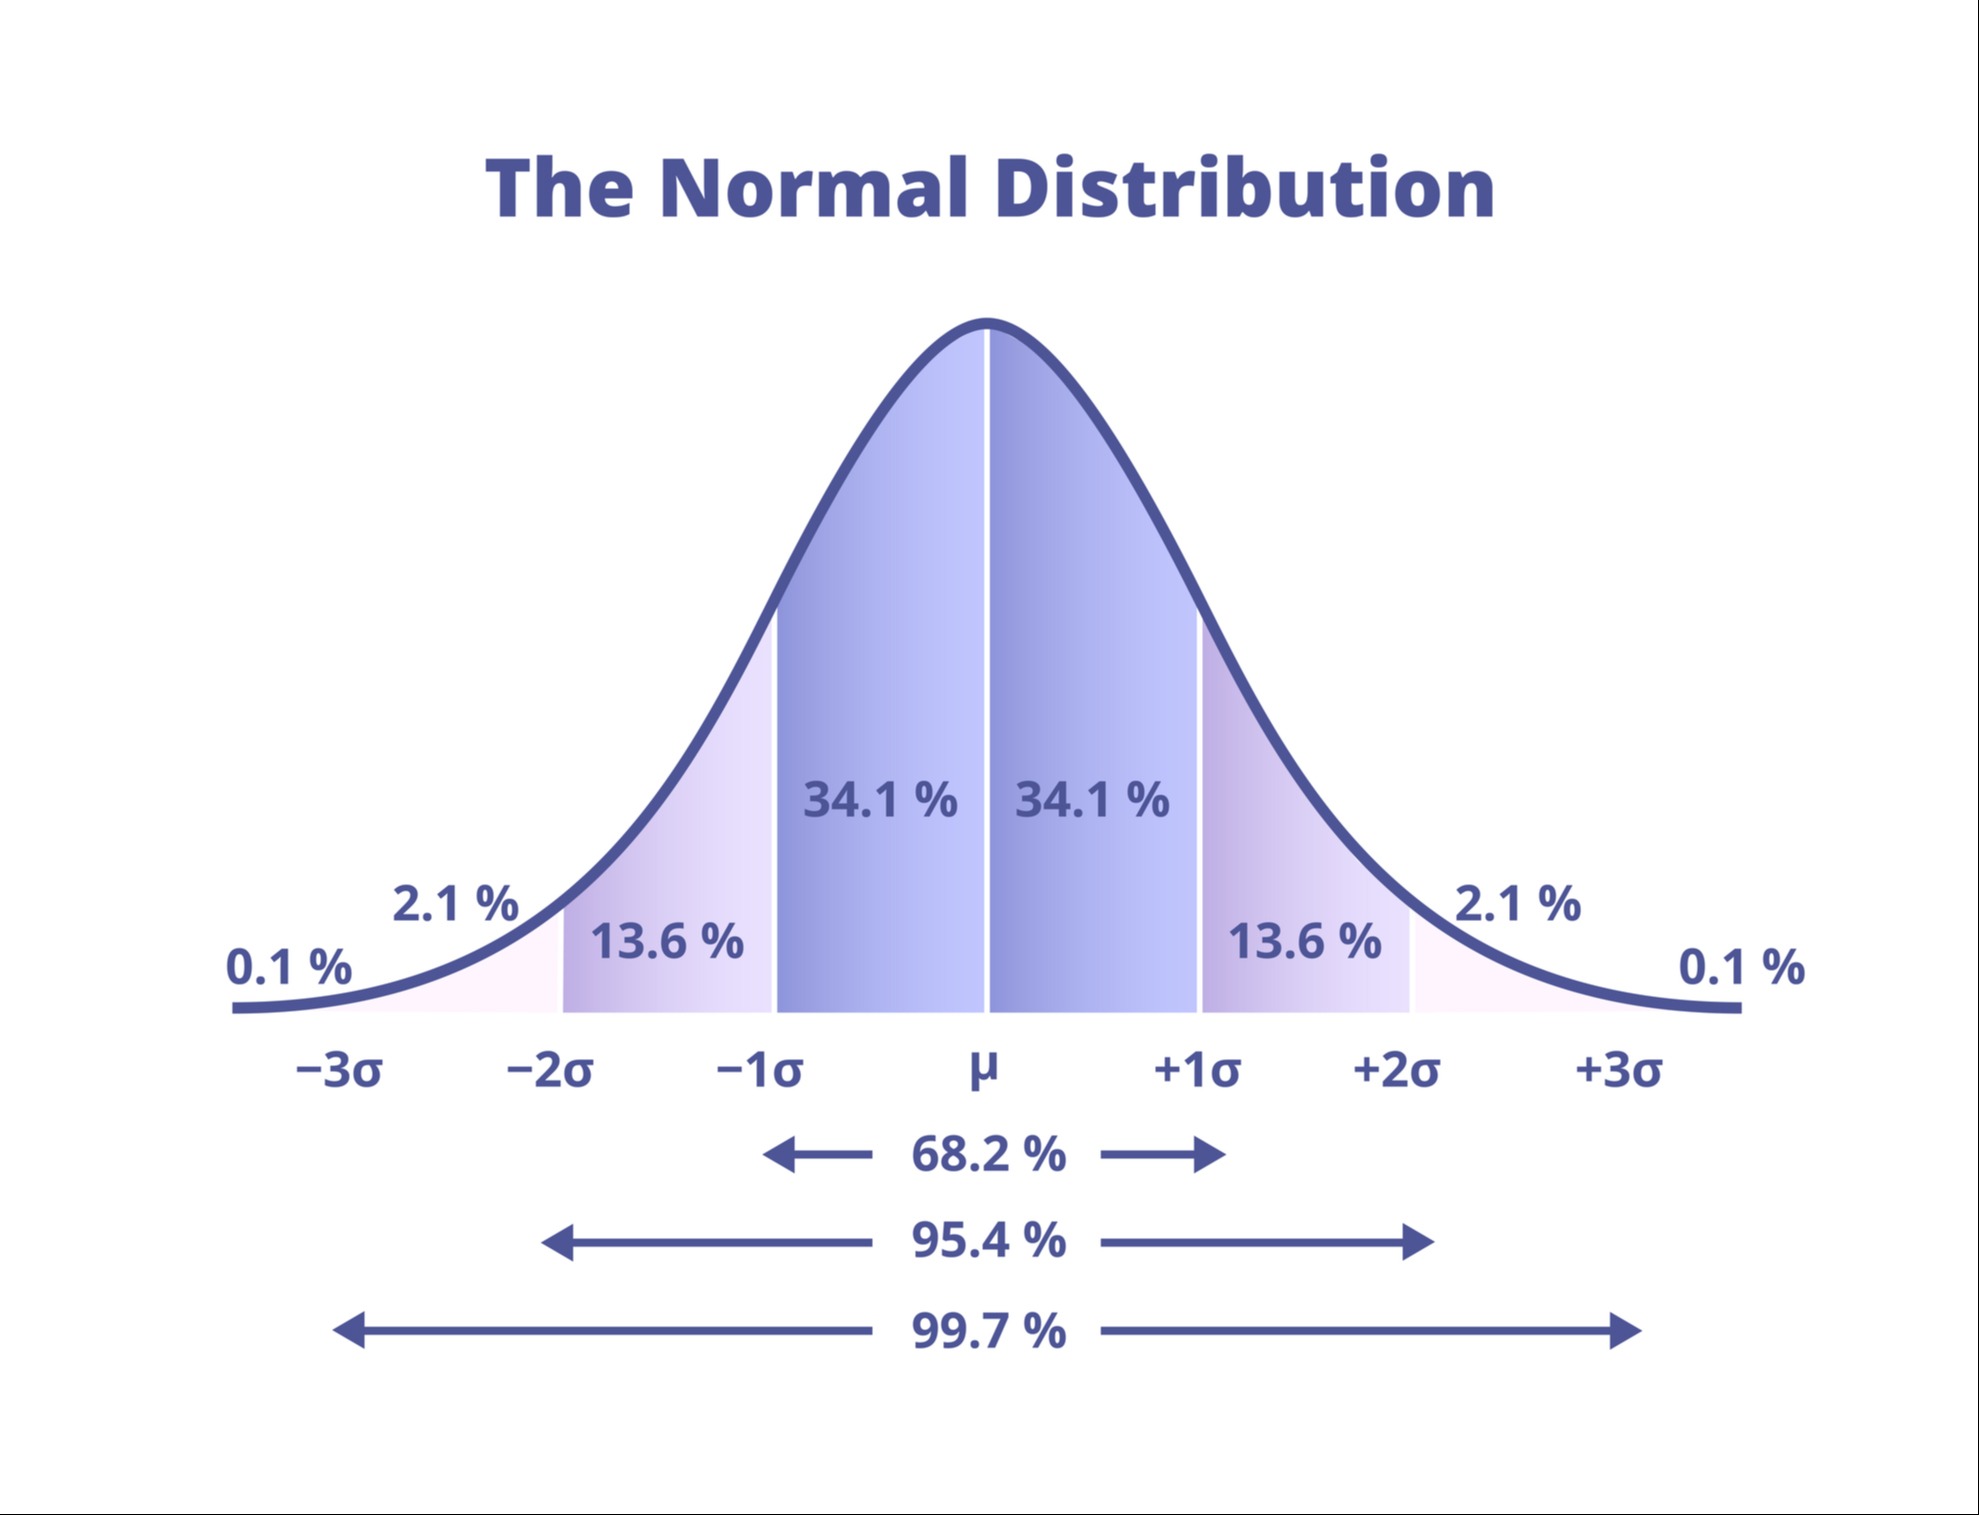
Below is a graphical representation of a "normal distribution" of data. It is commonly referred to as a "bell curve". The middle of the chart is where you find the majority of the data. This is the "average" or the "mean". Then, if the data is normally distributed, you will have some data that falls above the mean - falling to the right of the average - and you will have some data that falls to the left of the mean - falling to the left of the average.
Mathematically, we know that approximately 68.2% of the data will fall within one standard deviation from this average - 34.1% to the right and 34.1% to the left. We also know that 95.4% of the data will fall within two standard deviations from the average.
The point I want to highlight today is that 99.7% of the data should fall within three standard deviations of the average. In plain English, anything outside of three standard deviations should be very rare.
But, alas, this is not what we see in the financial markets. I offer the chart below as simple proof. This chart is constructed using the calculations from Greg Morris’ book Investing With The Trend. If you have not read that book, I highly recommend it – just know that it’s a commitment to get through it.
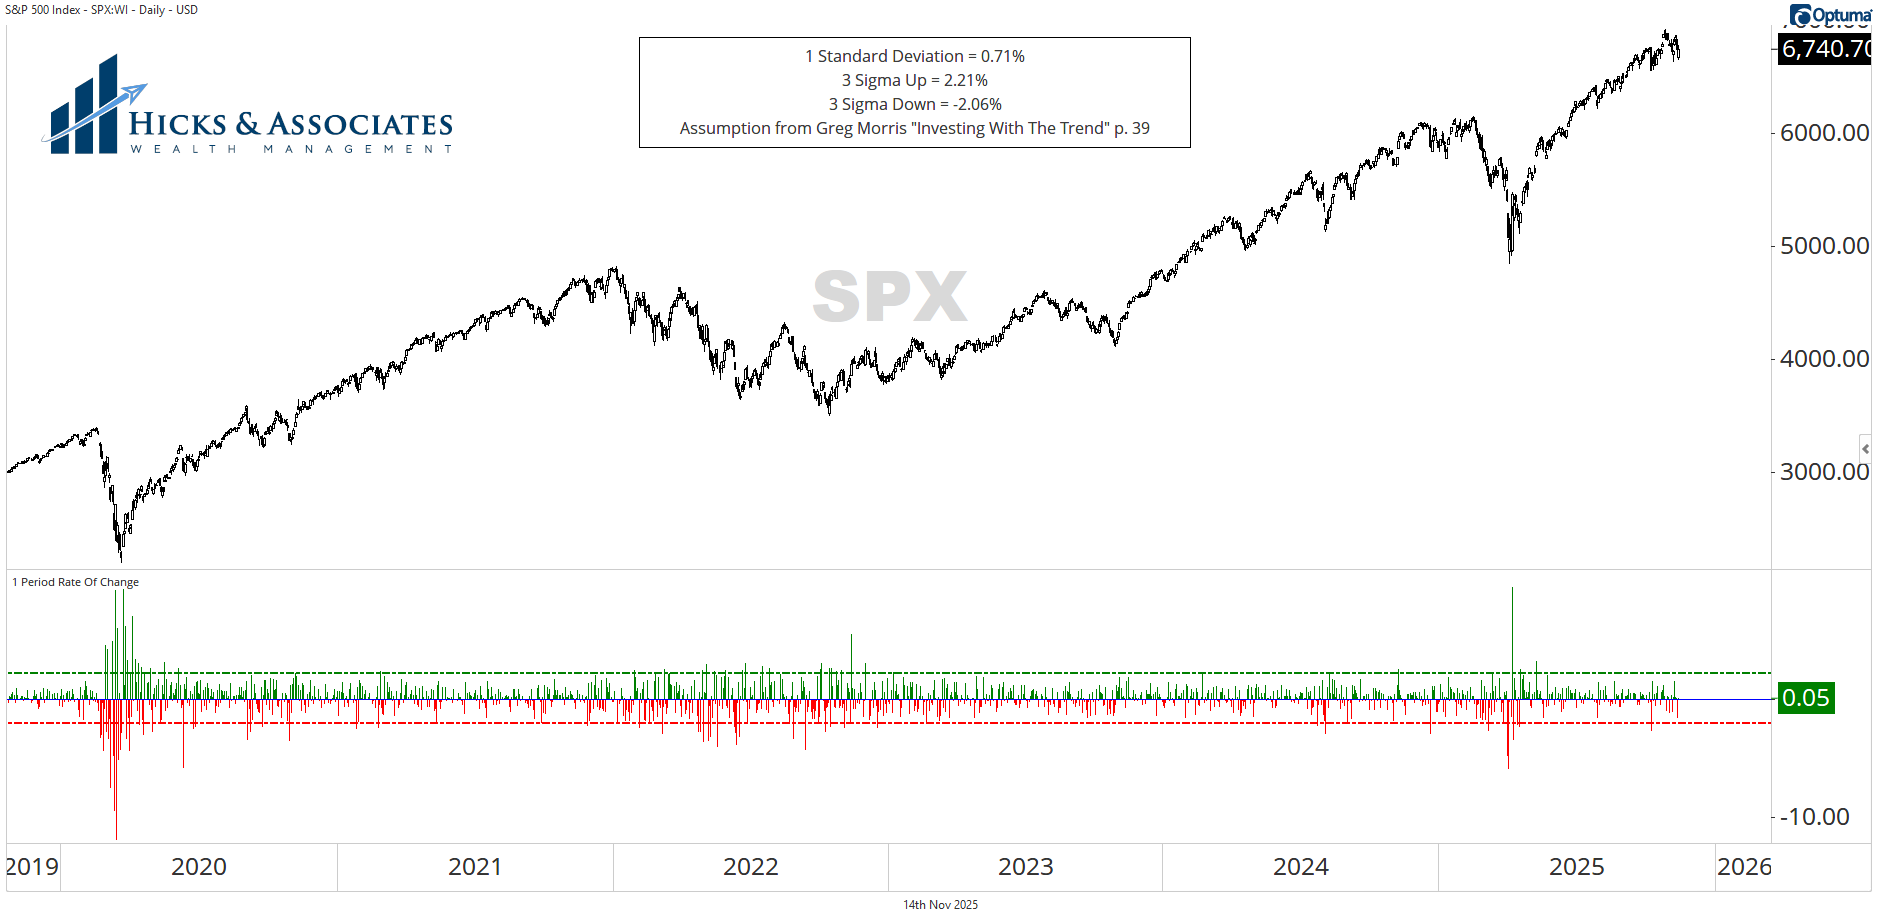
In his book, Greg documents how he calculates the average daily return and standard deviation for the S&P 500 over a 5-year lookback period. According to his work, the daily mean was 0.07% and the standard deviation was 0.71 percent. Once we have the standard deviation, we can determine that 3 sigma (standard deviation) up would be a daily return of 2.21% and 3 sigma down would be a daily return of negative 2.06%. In the bottom pane, 3 sigma up is denoted by the green dashed line and 3 sigma down is denoted with the red dashed line.
Remember, a 3 sigma day should be rare. But look at how often those red and green lines are touched. It turns out, 3 sigma days are far more common than they should be. We also see that they are frequently clustered together.
If you watched our latest YouTube video, you know that there is still a very large divergence in the stock market - and it's been getting worse. (If you have not seen the latest video, you can watch it here.) If the market's breadth broadens out and the average stock begins to move higher, this could be one way for the divergence to be resolved. Unfortunately, that is far from guaranteed.
This is why we remain vigilant.
After accumulating wealth, you don't want to witness your wealth suffering significant drawdowns. History teaches us that drawdowns begin unexpectedly and can last for unexpectedly long durations.
P.S. While Greg Morris' book is indeed fantastic, it is not for the faint of heart. When I wrote my book, Evidence-Based Investing, I wanted to write something that is very approachable by the average American. So far, the feedback that I've been receiving indicates that I succeeded in that endeavor. So, if you haven't already, pick up a copy at Amazon. Of course, if you are a client and would like a copy, just let me or my team know and we'll get one to you.
This information is intended to be educational. Hicks & Associates Wealth Management does not provide tax or legal advice. You should consult with a qualified tax, legal or financial professional before making any decisions.
Investment advisory services are offered through Hicks & Associates Wealth Management, LLC (“Hicks & Associates”), an investment adviser registered with the Securities and Exchange Commission. Registration as an investment adviser does not imply a certain level of skill or training. More information about Hicks & Associates can be found in Form ADV Part 2 or Form CRS which is available on our website.
Past performance is no guarantee of future returns. Hicks & Associates reserves the right to modify its current investment strategies and techniques based on changing market dynamics or client needs. The visuals shown are for illustrative purposes only and do not guarantee success or certain level of performance. This material contains projections, forecasts, estimates, beliefs and similar information (“forward looking information”). Forward looking information is subject to inherent uncertainties and qualifications and is based on numerous assumptions, in each case whether or not identified herein.
This information may be taken, in part, from external sources. We believe these external sources to be reliable, but no warranty is made as to accuracy. This material is not financial advice or an offer to sell any product. There is no guarantee of the future performance of any Hicks & Associates portfolio. The investment strategies discussed may not be suitable for all investors. Before investing, consider your investment objectives and Hicks & Associates charges and expenses. All investment strategies have the potential for profit or loss.