

The week just concluded - at least as far as trading is concerned - and it was a good week.
As I sit and sip my (second) cup of coffee while my family sleeps, I thought I'd take a look at a few charts. While we look at charts every day, zooming out and looking at the weekly data is often very helpful. It helps to dampen down the noise of the daily charts so we can see a bigger picture.
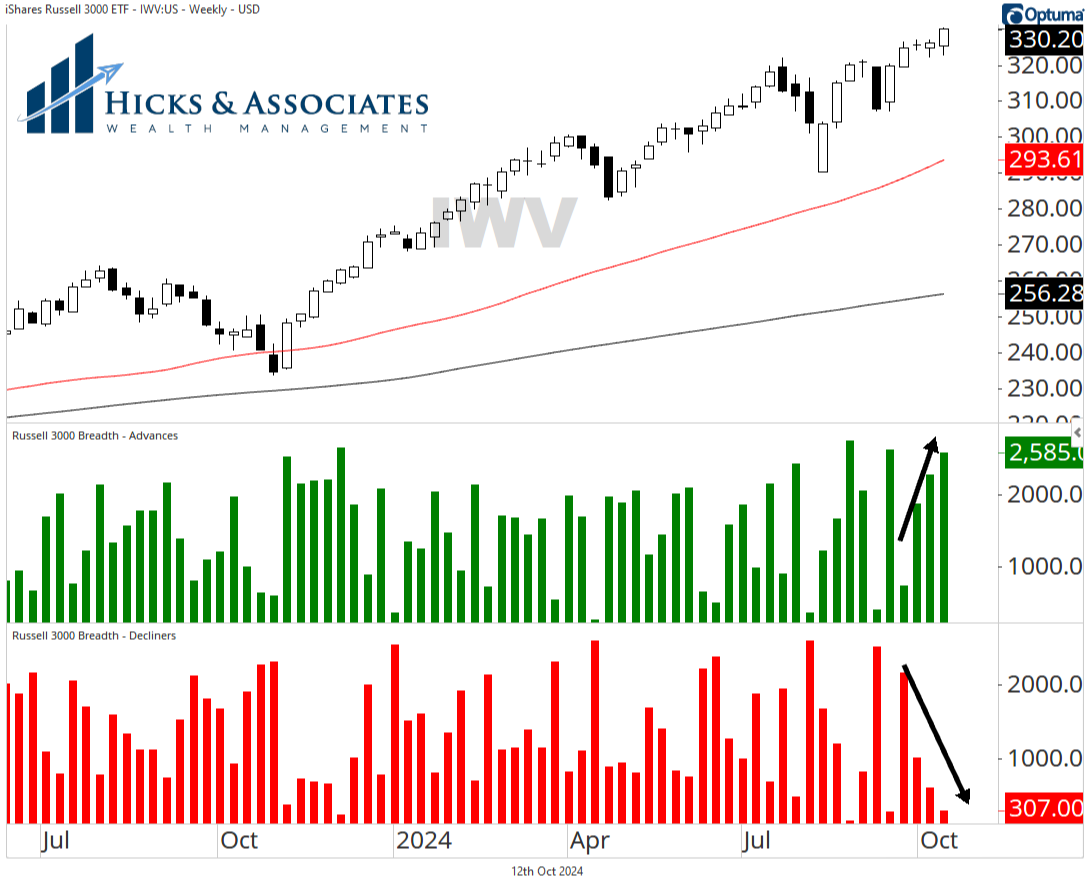
The chart below is the weekly chart for the iShares Russell 3000 ETF (Ticker: IWV). In the bottom pane, I'm showing the number of advancing stocks (represented by the green bars) and the number of declining stocks (represented by the red bars). When looking at this data in this weekly format, we can easily see that the last four weeks have seen an expanding list of advancing stocks while (naturally) the inverse is true for declining stocks. While nothing in this business is guaranteed, this is indeed an encouraging trend to see.
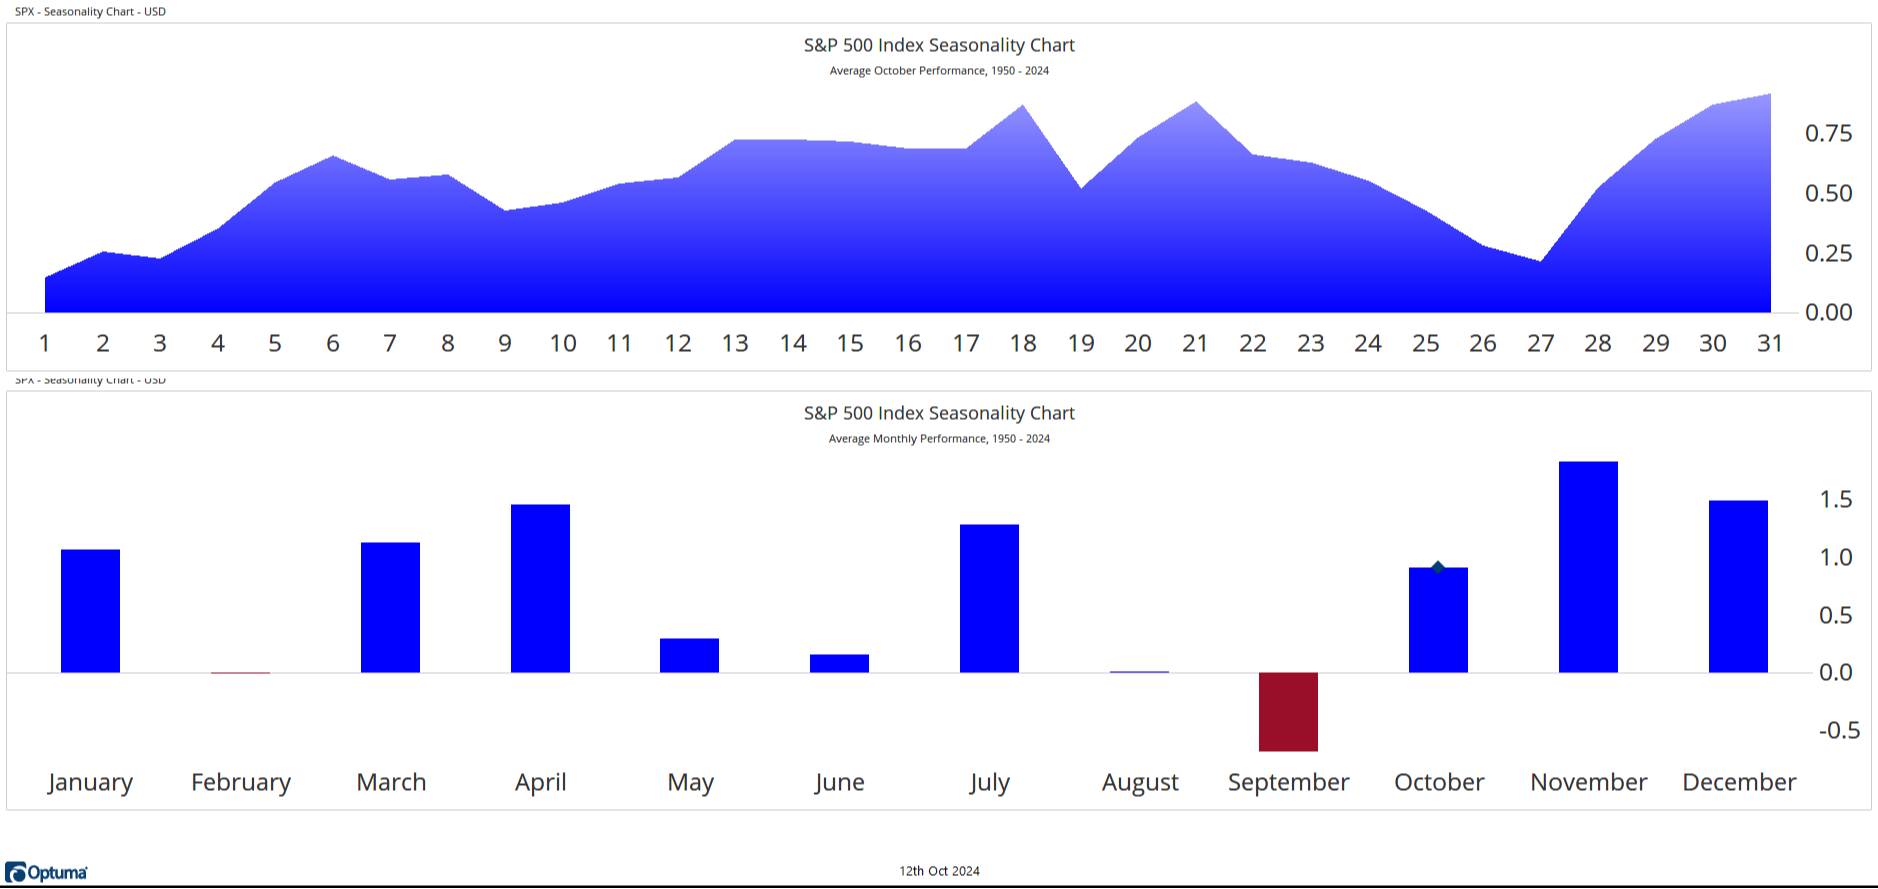
The second chart, is a Seasonality chart. The bottom pane is how we typically view the Seasonality chart. It shows the average performance for the S&P 500 broken down by month. As we've discussed in several YouTube videos, October through January is typically the best four months of stock market's year. If you look closely, you can see the blue diamond which represents October 2024. So far, this October is right at the month's average performance.
However, the top pane of this seasonality chart shows the average month of October broken down by day. You may recall from last month's Monthly Market Monologue video that September is historically a tale of two halves. The first half of September is historically decent, while the second half of September is historically bad. That did not happen this year, both the first half and the second half of September were pretty strong. Like everything in technical analysis, we cannot draw any firm conclusion from the historical average month of October. But when we look at the data, it is certainly good to see that October - typically a good month in the stock market - has already gotten off to a strong start with expanding breadth and the back half of October is historically also strong.
Enjoy your weekend ... I think I'm gonna get another cup of coffee.
This information is intended to be educational. Hicks & Associates Wealth Management does not provide tax or legal advice. You should consult with a qualified tax, legal or financial professional before making any decisions.
Investment advisory services are offered through Hicks & Associates Wealth Management, LLC (“Hicks & Associates”), an investment adviser registered with the Securities and Exchange Commission. Registration as an investment adviser does not imply a certain level of skill or training. More information about Hicks & Associates can be found in Form ADV Part 2 or Form CRS which is available on our website.
Past performance is no guarantee of future returns. Hicks & Associates reserves the right to modify its current investment strategies and techniques based on changing market dynamics or client needs. The visuals shown are for illustrative purposes only and do not guarantee success or certain level of performance. This material contains projections, forecasts, estimates, beliefs and similar information (“forward looking information”). Forward looking information is subject to inherent uncertainties and qualifications and is based on numerous assumptions, in each case whether or not identified herein.
This information may be taken, in part, from external sources. We believe these external sources to be reliable, but no warranty is made as to accuracy. This material is not financial advice or an offer to sell any product. There is no guarantee of the future performance of any Hicks & Associates portfolio. The investment strategies discussed may not be suitable for all investors. Before investing, consider your investment objectives and Hicks & Associates charges and expenses. All investment strategies have the potential for profit or loss.