

On the surface, so far, September has defied history.
But, we must look deeper than the surface. And when we look there, we are entering the toughest part of the worst month of the year.
This first chart is the Seasonality chart for IWM, the iShares Russell 2000 ETF. This is our preferred proxy for U.S. small company stocks. This data goes back to 2001, when IWM began trading. And the data is clear, September is clearly the worst month of the year. If I were to show you the Seasonality chart for the S&P 500, it also shows September is the worst month on the calendar.
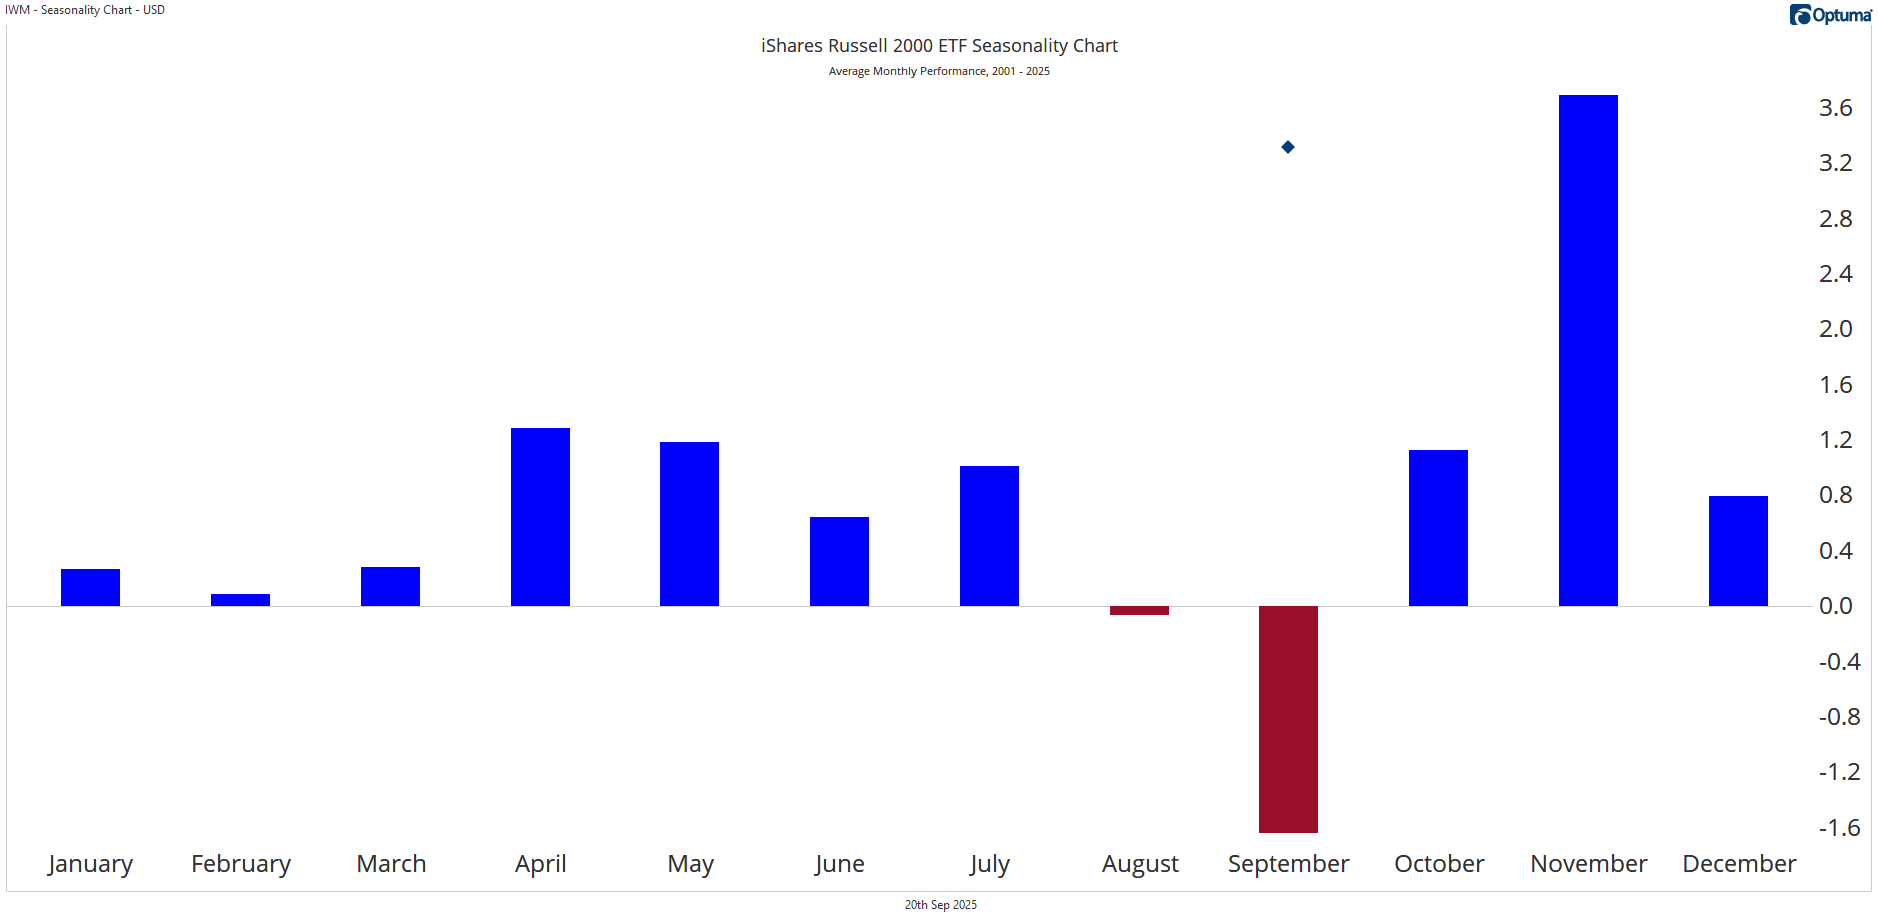
As I stated in a video blog I posted earlier this month, this does not mean that September is guaranteed to be bad. There were certainly some reasons why September 2025 might not be bad. And, if you look at the blue diamond in the chart above (which represents September 2025 through Friday the 19th), so far, this September has been pretty good.
But we have to look underneath the surface. The chart below allows us to do look deeper.
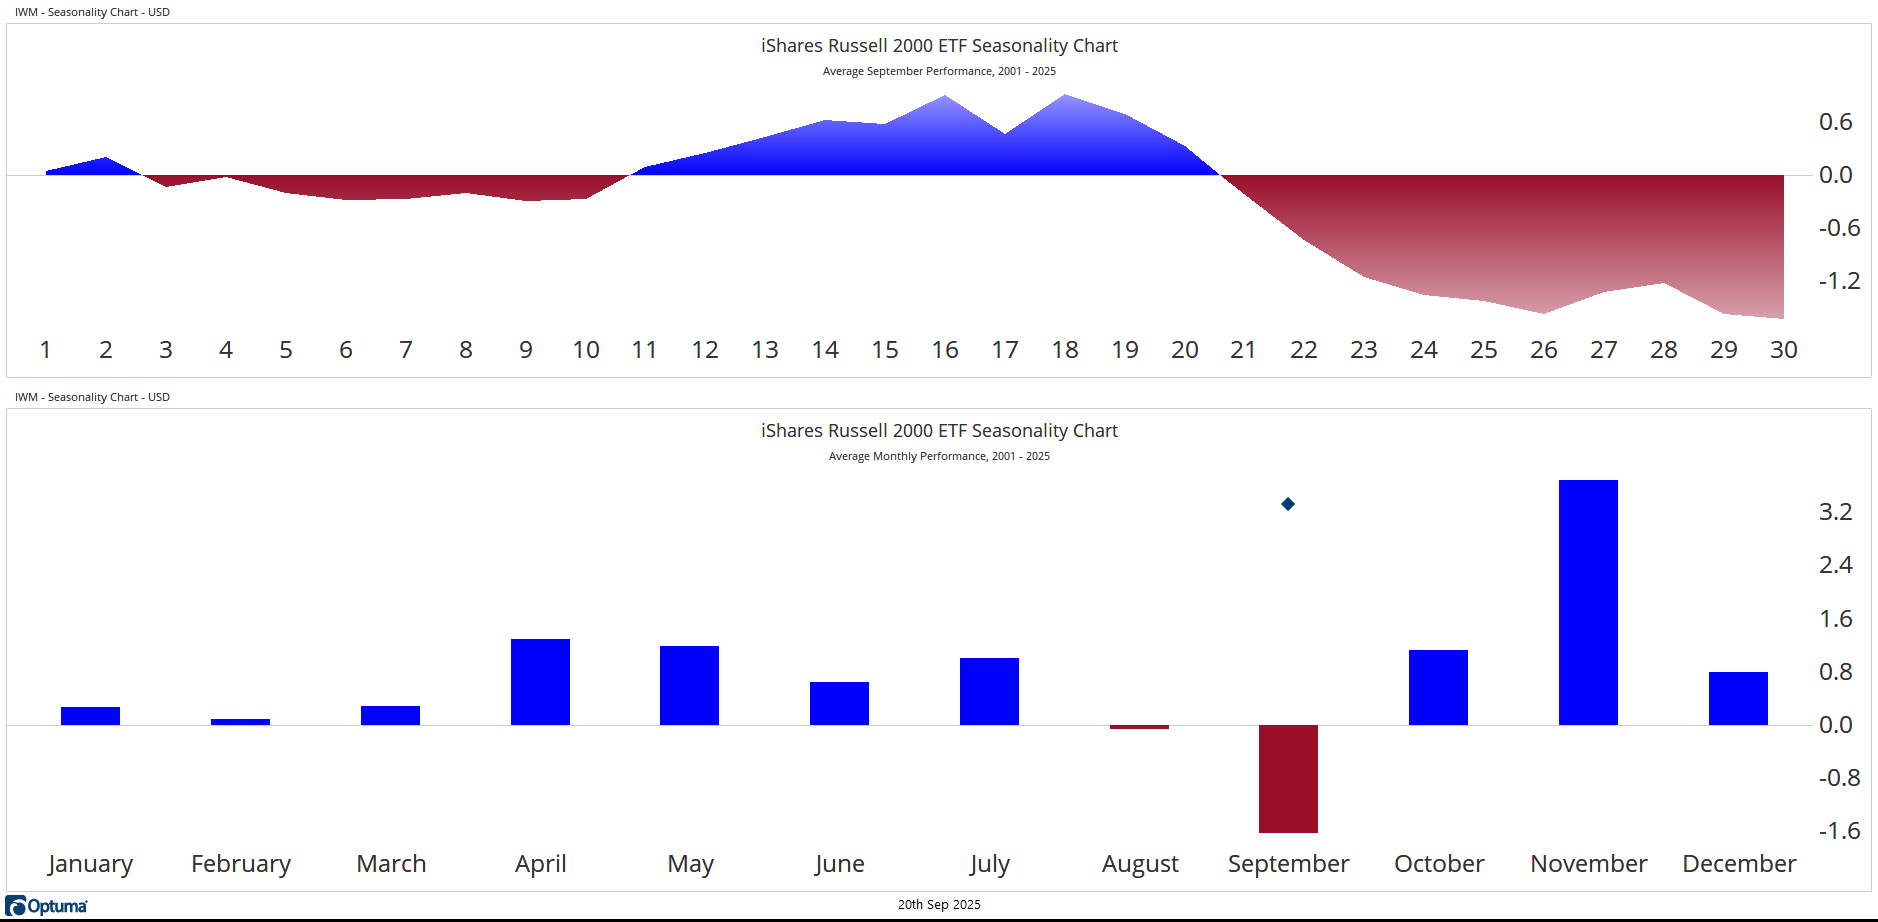
This second chart is the same Seasonality chart breaking down the average month (in the bottom pane) as well as showing you how September typically performs by day (in the top pane). When you break September down by day, we can see that we are entering the worst part of the worst month ... at least by historical patterns.
Is this pattern guaranteed to persist? No.
Does this mean that the rest of September will be bad? No.
Nothing is certain in this business.
However, let's take a look a one final chart.
The chart below is a daily candle chart for IWM, the same ETF that we have been examining above. Again, I've got two panes so you can see the problem clearly.
The top pane is the price chart. Notice the green arrow I've added so I can highlight the nice positive price trend since August 1st. Notice the last three candles. Wednesday was a volatile day. That is the day Chairman Powell and the Fed lowered interest rates. Fed day is almost always a volatile day.
But Thursday's candle was very positive. Nice strong day, allowing the Small-Cap index to close at new all-time highs! This is fantastic news.
Friday was not so great, but after hitting all-time highs on Thursday it is really not that surprising.
What I find surprising, and a little troubling is in the bottom pane.
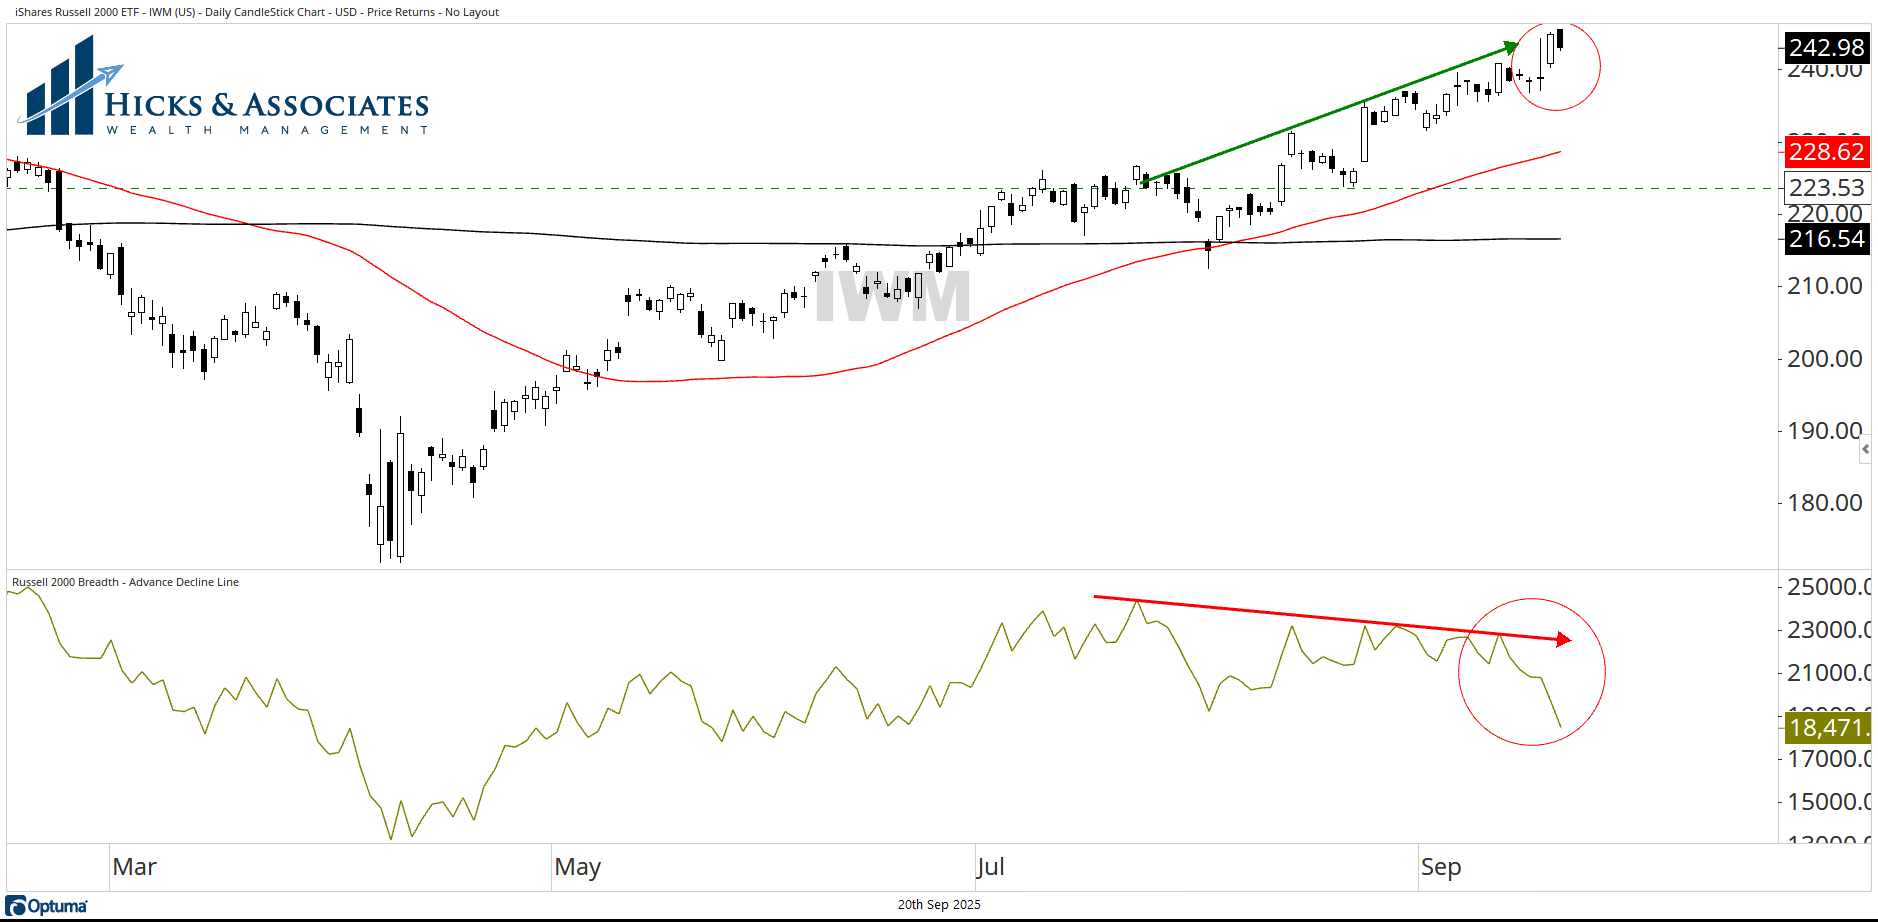
The bottom pane shows the Advance-Decline line for this ETF. It sounds complex, but it's really simple. The line is created by taking the number of stocks that are advancing and subtracting the stocks that are declining. When the line is pointing higher, that means we have more stocks advancing than we have declining. That's good news.
But that is not what we see here.
When I first saw it, right before going live on the NAAIM Confidential Podcast on Friday after the closing bell. (If you missed the live broadcast, you can watch the replay here.) Ryan and I chatted about this - this is NOT what I was expecting to see. So, I thought my data was wrong. That happens every once in a while. You have to know your data.
So, I contacted my data source. Early Saturday morning, I re-downloaded all the data just to double-check.
Unfortunately, I do not see any errors.
So while the price chart has been going up, more and more stocks within that price chart are going down. This is a negative divergence and it is not good news.
So, what do we do?
We will continue to follow our process. We took some gains off the table late in Friday's session. Every once in a while clients ask, "Why did you do that?" The data above is why. The rest of this month could be ugly. And while October through the end-of-year is typically good (especially in a POTUS First Year - but that's also something Ryan and I debated on the show), that is also not guaranteed. So, sometimes, it makes sense to take some of the gains off the table.
They might not be there tomorrow.
This information is intended to be educational. Hicks & Associates Wealth Management does not provide tax or legal advice. You should consult with a qualified tax, legal or financial professional before making any decisions.
Investment advisory services are offered through Hicks & Associates Wealth Management, LLC (“Hicks & Associates”), an investment adviser registered with the Securities and Exchange Commission. Registration as an investment adviser does not imply a certain level of skill or training. More information about Hicks & Associates can be found in Form ADV Part 2 or Form CRS which is available on our website.
Past performance is no guarantee of future returns. Hicks & Associates reserves the right to modify its current investment strategies and techniques based on changing market dynamics or client needs. The visuals shown are for illustrative purposes only and do not guarantee success or certain level of performance. This material contains projections, forecasts, estimates, beliefs and similar information (“forward looking information”). Forward looking information is subject to inherent uncertainties and qualifications and is based on numerous assumptions, in each case whether or not identified herein.
This information may be taken, in part, from external sources. We believe these external sources to be reliable, but no warranty is made as to accuracy. This material is not financial advice or an offer to sell any product. There is no guarantee of the future performance of any Hicks & Associates portfolio. The investment strategies discussed may not be suitable for all investors. Before investing, consider your investment objectives and Hicks & Associates charges and expenses. All investment strategies have the potential for profit or loss.