


The chart above is for IWM, the iShares Russell 2000 ETF. It is commonly used to gauge the "small-cap", or small company, equities. The reality is that you cannot have a robust bull market if the smaller companies are not participating.
While this small company index ETF rallied strong off the April lows, when they pushed into new high ground in late October, they almost immediately corrected. We can see this clearly if we zoom in.
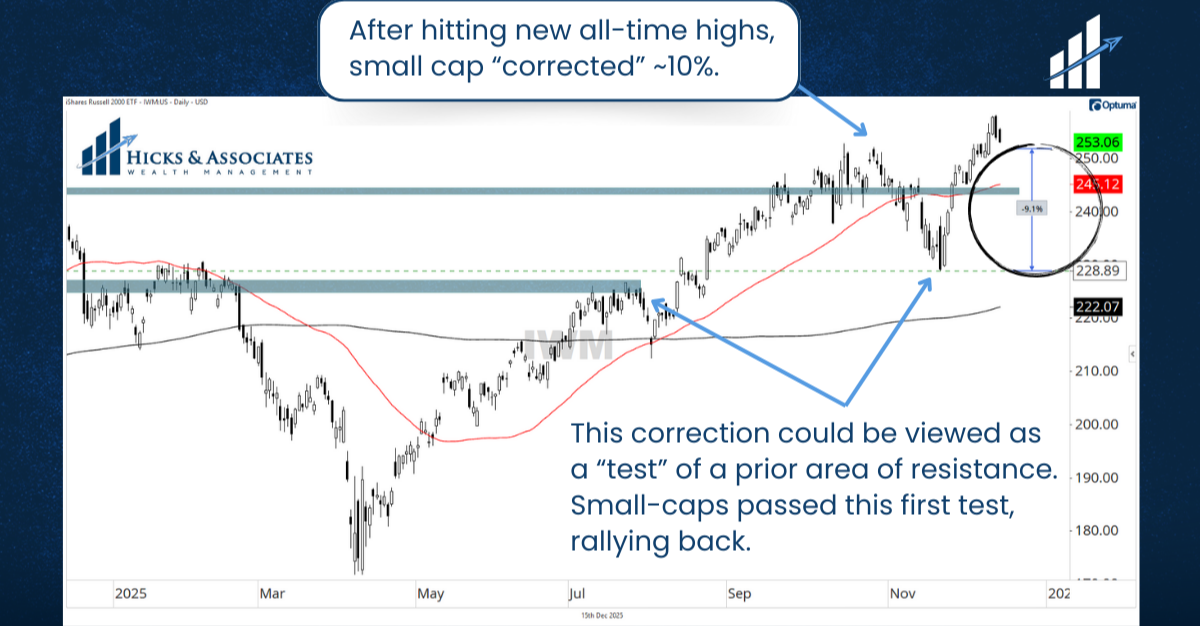
By zooming in to the current action, we see that this correction was almost 10%. While we know that corrections are very common and often very healthy, we never know if a correction is going to lead to a bear market. This is why we defend our gains and limit our losses so quickly, we simply have no idea what tomorrow is going to bring.
But take a closer look to where the correction was arrested. To make it easier, let me show you another chart.
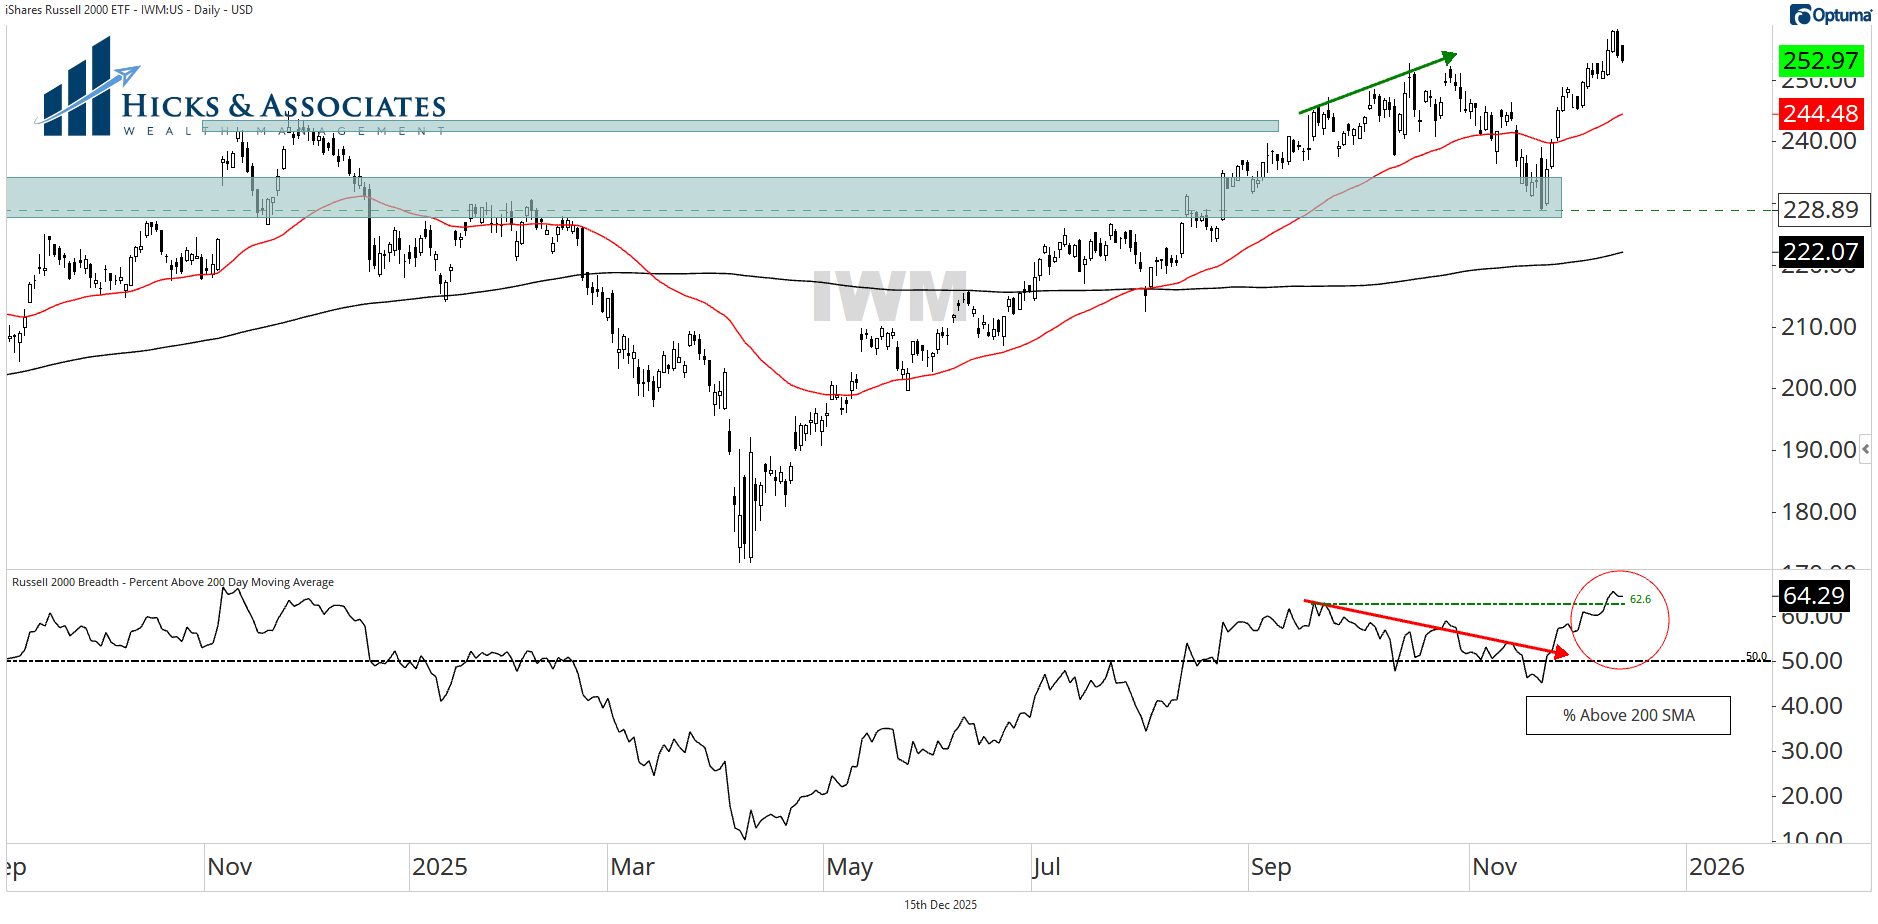
In this version of the chart, I've extended the lower blue-gray rectangle to the right and widened it a bit. Remember, the reason I annotate a chart is to help my eye. But it is important to know that all such annotations are interpretations. So, the way I first drew that rectangle was a very narrow interpretation of what I thought might be a support zone. But, it is a zone, not a certain price.
Ultimately, this area did in fact serve as support. And if you return to the first chart at the top of this article, you can see that this area of support is actually the area of resistance from late 2020 and throughout 2021.
This is classical technical analysis. What used to be an area of resistance has become support. Furthermore, once such an area transitions from a resistance zone to a support zone, it frequently must be tested.
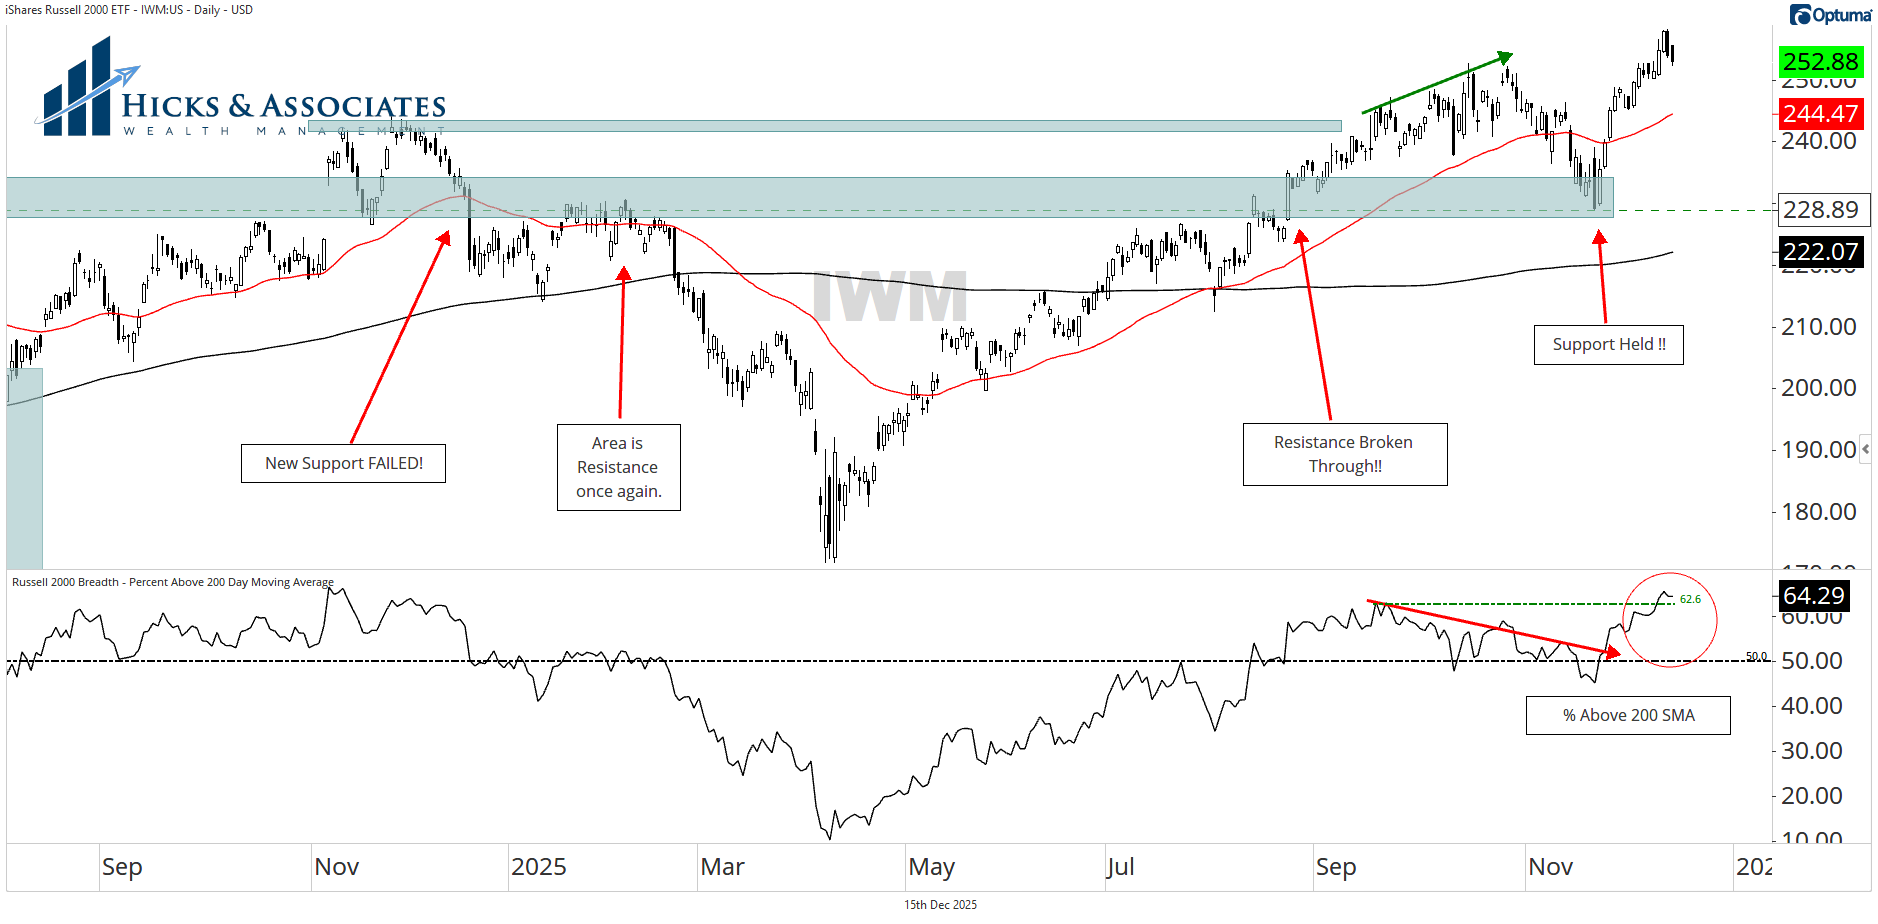
In this final version of the chart, take a look at the left side. In November 2024, right after the U.S. elections, the small caps moved higher on a nice gap. It broke through this area of resistance. Later that month, small-caps tested that area which was formerly resistance. The area initially held. But just a couple of short weeks later, this area failed as support.
Moving to the right, we see that this zone, once again, returned to being an area of resistance. The small company index just could not break back through this area. Then, when the S&P 500 corrected earlier this year, the small company index also moved lower.
Fast forward to September and we can see that this small company index was once again able to break through that area of resistance. So, when this index started to correct again in late October, it was reasonable to expect to see this area come into play once again. Would it serve as support? Would that support hold? That area got tested and it passed the test. This is good news.
Last point for today, take a look at the bottom pane. The bottom pane is the percent of this small cap index that is trading above their own 200-day moving average. Notice the red down trendline. Notice how that trendline coincides with a positive green trendline in the price chart above. That is a negative divergence. That divergence has been resolved and we just concluded a week with a new 2025 high in the percent of small cap stocks that are trading above their 200-day moving average.
This is the kind of participation we really need to see if we are truly in a robust bull market.
Merry Christmas to all. May we all rejoice at the celebration of the birth of Our Savior.
This information is intended to be educational. Hicks & Associates Wealth Management does not provide tax or legal advice. You should consult with a qualified tax, legal or financial professional before making any decisions.
Investment advisory services are offered through Hicks & Associates Wealth Management, LLC (“Hicks & Associates”), an investment adviser registered with the Securities and Exchange Commission. Registration as an investment adviser does not imply a certain level of skill or training. More information about Hicks & Associates can be found in Form ADV Part 2 or Form CRS which is available on our website.
Past performance is no guarantee of future returns. Hicks & Associates reserves the right to modify its current investment strategies and techniques based on changing market dynamics or client needs. The visuals shown are for illustrative purposes only and do not guarantee success or certain level of performance. This material contains projections, forecasts, estimates, beliefs and similar information (“forward looking information”). Forward looking information is subject to inherent uncertainties and qualifications and is based on numerous assumptions, in each case whether or not identified herein.
This information may be taken, in part, from external sources. We believe these external sources to be reliable, but no warranty is made as to accuracy. This material is not financial advice or an offer to sell any product. There is no guarantee of the future performance of any Hicks & Associates portfolio. The investment strategies discussed may not be suitable for all investors. Before investing, consider your investment objectives and Hicks & Associates charges and expenses. All investment strategies have the potential for profit or loss.