


If you've been reading our content for any length of time, you've seen the chart above. This is the Value Line Geometric Average. You will - hopefully - recall that the Value Line is a much better measurement of the United States stock market for two main reasons:
- The S&P 500 - logically - only captures the performance of about 500 stocks. (Technically, there are 503 stocks in this index right now.) The Value Line Geometric Average captures almost 1,700 stocks; so more than three times as many.
- The S&P 500 is "Cap-Weighted" meaning the top stocks in the index really control the index. The vast majority of the stocks in that index have very little influence. The Value Line, however, is "Equal-Weighted" meaning every stock has just as much or as little influence as the next one.
For those two reasons, we tend to look at the Value Line to get a more accurate reading of the health of the U.S. stock market. Right now, well for some time now, the Value Line isn't giving much encouraging news.
Here's the quick run down:
- The Value Line was basically flat for 2025. The conclusion, in 2025 the average stock under-performed a decent money market fund.
- At the end of 2025, we expected the Value Line to break out and finally advance. It did just that ... for two months.
- Once the War with Iran started the Value Line broke down - like everything - and ultimately made a low on March 30th.
Since that low was put in on March 30th, just about everything has rallied. But the bifurcation has returned.
Take a look at this chart:
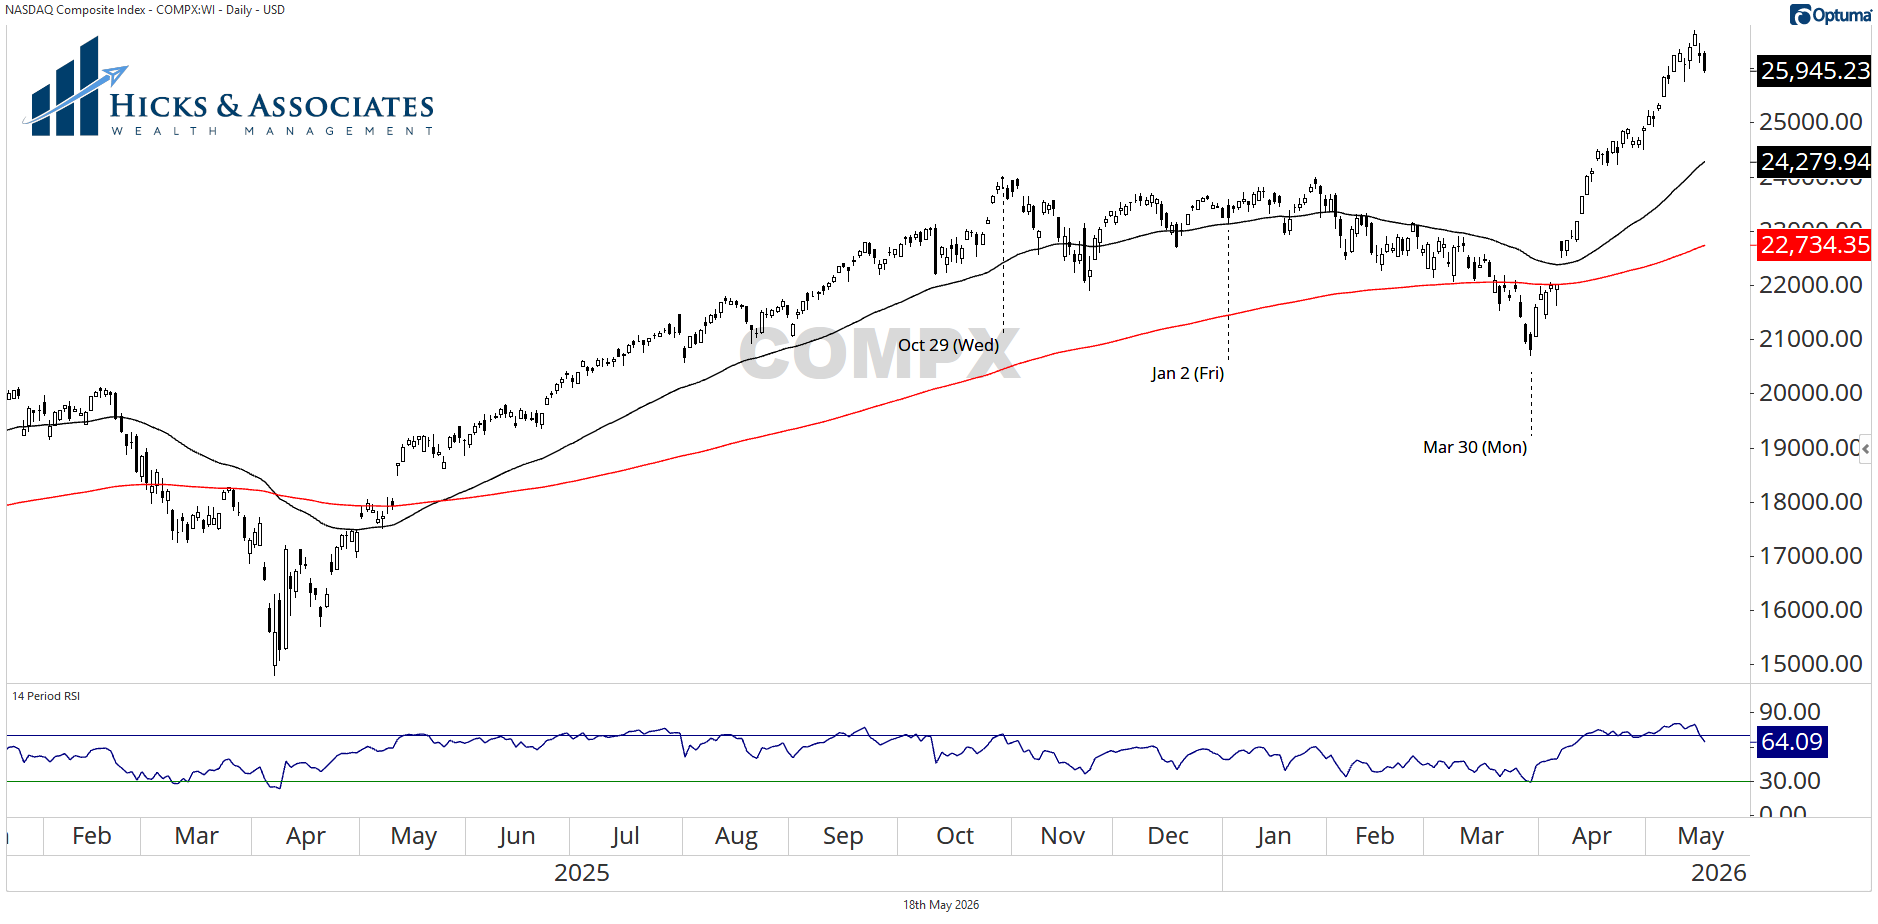
This is the daily candle chart for the NASDAQ and, as you can see, it ripped roared higher after that March 30th low. The last two sessions, we've seen a little bit of a pause, but that was also expected given the reading on the RSI (bottom panel).
Now compare this chart of the NASDAQ to the Value Line. We could argue that the NASDAQ is pausing after getting over-extended. But the Value Line appears to be breaking down, putting in new short-term lows.
That's not good news and it's a sign of the extreme bifurcation of this market. Don't let the main indices deceive you: risk abounds.
This information is intended to be educational. Hicks & Associates Wealth Management does not provide tax or legal advice. You should consult with a qualified tax, legal or financial professional before making any decisions.
Investment advisory services are offered through Hicks & Associates Wealth Management, LLC (“Hicks & Associates”), an investment adviser registered with the Securities and Exchange Commission. Registration as an investment adviser does not imply a certain level of skill or training. More information about Hicks & Associates can be found in Form ADV Part 2 or Form CRS which is available on our website.
Past performance is no guarantee of future returns. Hicks & Associates reserves the right to modify its current investment strategies and techniques based on changing market dynamics or client needs. The visuals shown are for illustrative purposes only and do not guarantee success or certain level of performance. This material contains projections, forecasts, estimates, beliefs and similar information (“forward looking information”). Forward looking information is subject to inherent uncertainties and qualifications and is based on numerous assumptions, in each case whether or not identified herein.
This information may be taken, in part, from external sources. We believe these external sources to be reliable, but no warranty is made as to accuracy. This material is not financial advice or an offer to sell any product. There is no guarantee of the future performance of any Hicks & Associates portfolio. The investment strategies discussed may not be suitable for all investors. Before investing, consider your investment objectives and Hicks & Associates charges and expenses. All investment strategies have the potential for profit or loss.